Log polar mapping


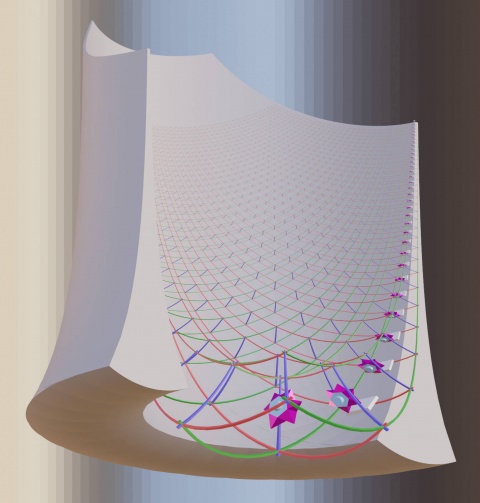
This page is about a generalization of log-polar mapping to 3D space. Specifically usable as one of the visualization methods for gemstone metamaterial factories and as one of the distorted visualization methods for convergent assembly.
Contents
Motivation
Log polar mapping should be well suitable for a static poster showing all relevant internals of a nanofactory.
Being able to display/visualize all the convergent assembly levels (and routing levels) of an entire nanofactory all at once (in 3D) without needing to resort to a animation/video format doing some zooming in/out. Displaying more at once also makes more apparent that smaller machinery operates at higher frequency (not higher speed though - careful!).
Animation can still be added showing the activity at all scales at once and making the continuity of matter transport more obvious. Logistics and things like level crossing lag to the first initial output.
Displaying many scales and their relation simultaneously
This can be done by generalizing log polar mapping to 3D like so:
- x'(x,y,z) = pi/2 - atan2( z, sqrt(pow(x,2) + pow(y,2)) ) * cos(atan2(y,x)))
- y'(x,y,z) = pi/2 - atan2( z, sqrt(pow(x,2) + pow(y,2)) ) * sin(atan2(y,x)))
- z'(x,y,z) = log( sqrt(pow(x,2) + pow(y,2) + pow(z,2)) ) / log(base)
Related
- Distorted visualization methods for convergent assembly
- Visualization methods for gemstone metamaterial factories
- Challenges in the visualization of gem-gum factories
External links
- https://en.wikipedia.org/wiki/Log-polar_coordinates
- 1996 – An Introduction to the Log-Polar Mapping – Helder J. AraujoJorge Miranda DiasJorge Miranda Dias – ResearchGate
Not log polar mapping but mercator projection to the extreme.
This should be locally similar to log polar mapping in that math in the limit becomes identical.
https://mrgris.com/projects/merc-extreme/
