Annotated lambda diagram

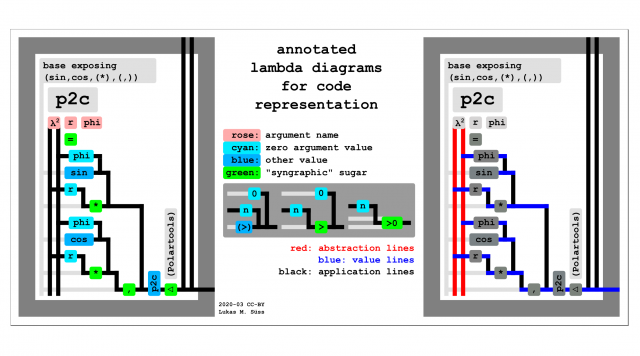
For details see: ALDs – example Cartesian to polar.

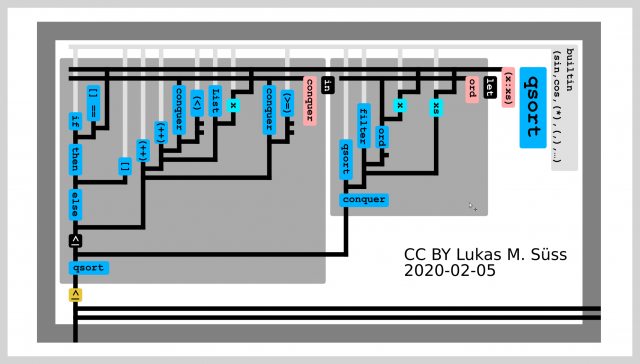
For details see: ALDs – example quicksort.
Contents
Introduction: The problem with current day programming
Current day (2021) programming has an accessibility problem.
The effect is that so called "end users" often see obvious trivial problems that they should be easily able to fix but can't because
- There is a stack of tools to learn before even to begin.
– It's so bad that a job description emerged "full stack developer" - Publishing something that is an interactive program is not easy anymore.
– It's so bad that this bloated unnecessary process now has a name "deployment" a hole terminology and an "industry" around it has evolved - The tools for programming either have a deterring learning curve or quickly run out of expressiveness.
The causes for this (on a highest abstraction-level) are likely twofold:
- (A) the increasing centralization of the internet – an emerging governance problem – (perhaps "eternally" periodically waving)
- (B) a technical software crisis – (sheer technical difficulty and an economics caused focus on short term investment focusing on symptoms rather than causes)
The Annotated lambda diagrams discussed here would be an attempt in tackling the latter point (B).
Lambda calculus – it's basic rules are unbelievably simple and it can compute anything and everything
Lambda diagrams are a way to visualize lambda calculus.
Lambda calculus is an extremely simple formalism that is equally expressive to the (much better known) Turing machine.
That is: Lambda calculus is "Turing complete". Any program that is in principle logically possible can be written in Lambda calculus. A maximally universal computer. At least that is what is the current (2021) consensus on the topic.
The special thing about lambda calculus is that it is used very much unchanged as the core of a number of rather practical programming languages. Perhaps more so than the Truing machine is.
Graphical visualizations for lambda calculus
There are a number of graphical visualizations for Lambda calculus.
The most straightforward one is just to plot out the syntax tree.
There are only three elements in that syntax tree: abstractions, applications, and variables.
Plain lambda diagrams (PLDs)
An especially nice visualization for lambda calculus are (unannotated) "lambda diagrams".
These are presented by John Tromp on his homepage here: https://tromp.github.io/cl/diagrams.html
Annotated lambda diagrams (ALDs)
The basic idea in brief bullet points
- annotate plain lambda diagrams with: variable names, types, current values, kinds (aka types of types), ... (not all shown per default of course)
- Make them into a structured editor where you can type normally pretty much as you would in "plain textfile code editing"
– (See: Fructure Specifically in this video with Andrew Blinn shortly after 6:03 [1] where he says "My preferred alternative is to simply type normally") - Add progressive exposure!!!
- Make program fragments drag and drop interactive (like puzzle pieces)
Give reasonable visual cues for efficiency (rather than fancy): identicons, arity mismatch visualization, ... - Make them support typed holes of input, output, and bridge type.
Such that program fragments are extendable: upstream, downstream, and ...
can also be tied up in one or more still open concurrent paths (wiki-TODO: make a sketch)</small> - (Eventually make data flow around holes as far as this is possible. See: Hazel)
- Add type directed context sensitive suggestions for extending onto the present holes
- Put them into a zooming user interface (ZUI) that allows for (arbitrarily deep) in place evaluation preview
- Add inverse tabs – allowing to navigate the codebase different upstream paths that where formerly traced downstream
Eventually add higher level data visualization:
- that follow code structure (see: Tangible values – by Conal Elliott) – but with added progressive exposure.
- that give an immediate connection by bidirectional data-flow (see: Drawing Dynamic Visualizations – by Bret Victor) (See: enso language)
Totally trearing down the GUI vs commandline rift!
The idea is as follows:
If all progressive exposure is closed then the UI is completely indistinguishable from a conventuinal GUI.
Except one little "+" or something as the starting point for progressive exposure.
A progressive exposure step opens up the ALD that corresponds to the visual element.
From there the "end-user" (now elevated to "deveuser") can trace the codebase to non-displayed or even non-visual code elements.
Trace via the the nicely visually traceable lines in the ALD.
Exposing enough GUI elements and hiding the visualization one eventually ends up with Just ALDs or
some other code projection like conventional purely textual ones.
Add to that: Bookmarking of "interface visualizations" and
organizing "code" documentation and data storage in a desktop wiki like system that
is implemented in that whole programming system in a bootstrapped way.
The basic benefits
Combines the best of the two worlds of textual and graphical code:
- Almost as traceable as graphical code (since there are traceable "program circuit" lines)
– these lines are quite different to "conventional" graphical programming though - Almost as scaleable as textual code (since the structure closely follows textual code) – a little less dense
Does NOT combine the worst of the two worlds:
- unscalability of graphical wire-monster-krakens and
- hard tracability of excessively indirected textual codebases)
- Seeing the whole code multiverse at a glance and and the live running state as a literal "red thread" within.
- Browsing the codebase in all dimensions without detours and disruptive jumps
Human mental RAM is limited, it shouldn't be used for pointless navigation hurdles.
External links
A basic write-up of some ideas with links to twitter posts.
(wiki-TODO: this needs to be published more properly (that is: more resilliently))