Difference between revisions of "Log polar mapping"
m (→External links) |
m (→Motivation) |
||
| Line 11: | Line 11: | ||
== Motivation == | == Motivation == | ||
| − | '''Log polar mapping should be well suitable for a static poster showing all relevant internals of a nanofactory.''' <br> | + | '''Log polar mapping should be well suitable for a static poster showing all relevant internals of a nanofactory simultaneously.''' <br> |
Being able to display/visualize all the convergent assembly levels (and routing levels) of an entire nanofactory all at once (in 3D) without needing to resort to a animation/video format doing some zooming in/out. Displaying more at once also makes more apparent that smaller machinery operates at higher frequency (not higher speed though - careful!). | Being able to display/visualize all the convergent assembly levels (and routing levels) of an entire nanofactory all at once (in 3D) without needing to resort to a animation/video format doing some zooming in/out. Displaying more at once also makes more apparent that smaller machinery operates at higher frequency (not higher speed though - careful!). | ||
Revision as of 13:27, 7 February 2024


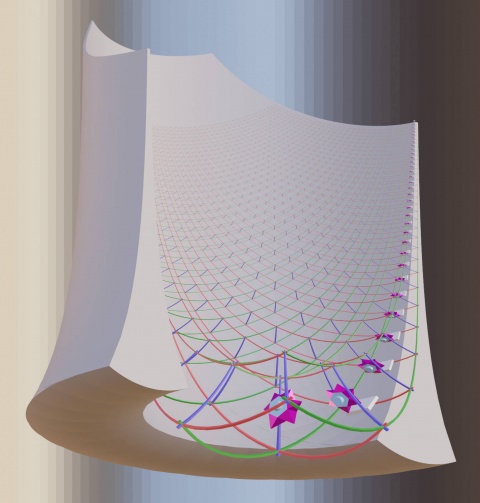
This page is about a generalization of log-polar mapping to 3D space. Specifically usable as one of the visualization methods for gemstone metamaterial factories and as one of the distorted visualization methods for convergent assembly.
Contents
Motivation
Log polar mapping should be well suitable for a static poster showing all relevant internals of a nanofactory simultaneously.
Being able to display/visualize all the convergent assembly levels (and routing levels) of an entire nanofactory all at once (in 3D) without needing to resort to a animation/video format doing some zooming in/out. Displaying more at once also makes more apparent that smaller machinery operates at higher frequency (not higher speed though - careful!).
Animation can still be added showing the activity at all scales at once and making the continuity of matter transport more obvious. Logistics and things like level crossing lag to the first initial output.
Displaying many scales and their relation simultaneously
This can be done by generalizing log polar mapping to 3D like so:
- x'(x,y,z) = pi/2 - atan2( z, sqrt(pow(x,2) + pow(y,2)) ) * cos(atan2(y,x)))
- y'(x,y,z) = pi/2 - atan2( z, sqrt(pow(x,2) + pow(y,2)) ) * sin(atan2(y,x)))
- z'(x,y,z) = log( sqrt(pow(x,2) + pow(y,2) + pow(z,2)) ) / log(base)
This is a natural generalization of the much more commonly used 2D case.
Relation to more common 2D log polar mapping
Using z instead of y to better match the analogy.
- x' = atan2(y,x)
- z' = log( sqrt(pow(x,2) + pow(z,2)) ) / log(base)
In both 2D and 3D case: z' corresponds to the radius of a circle or sphere (respectively) just logarithmized.
This should be reasonably intuitive to comprehend.
The logarithm is converting scale invariance/symmetry into translational invariance/symmetry.
In the 2D case: x' corresponds to the the angle on a circle. Unrolling a circle. Quite intuitively to comprehend.
In the 3D case: x' and y' correspond going around a sphere in the direction given by the y/x ratio ~ atan2(y/x).
Unlike in the 2D case where one can go the full 360° without any issue,
in the 3D case after going 90° (and thus crossing the xy-plane) the sphere at a
constant cutting cylinder radius gets smaller again and eventually meets up
with coming around the sphere from other sides.
For that reason for the negative 3D half-space is being heavily distorted
(to the point that the 1D linear negative z-axis is blown up to a 2D cylinder wall).
Using just the positive half-space though is plenty for illustrating convergent assembly where there is a bottom.
Related
- Distorted visualization methods for convergent assembly
- Visualization methods for gemstone metamaterial factories
- Challenges in the visualization of gem-gum factories
External links
- https://en.wikipedia.org/wiki/Log-polar_coordinates
- 1996 – An Introduction to the Log-Polar Mapping – Helder J. AraujoJorge Miranda DiasJorge Miranda Dias – ResearchGate
Relation to Mercator projection taken to the extreme ends
Not log polar mapping but Mercator projection to the extreme.
This should be locally similar to log polar mapping in that math in the limit becomes identical.
https://mrgris.com/projects/merc-extreme/
- https://en.wikipedia.org/wiki/Mercator_projection
(wiki-TODO: show that in the limit it gets equivalent to log polar - does it?)
