Difference between revisions of "Distorted visualization methods for convergent assembly"
m (added image) |
(Added second image showing two assembly levels) |
||
| Line 1: | Line 1: | ||
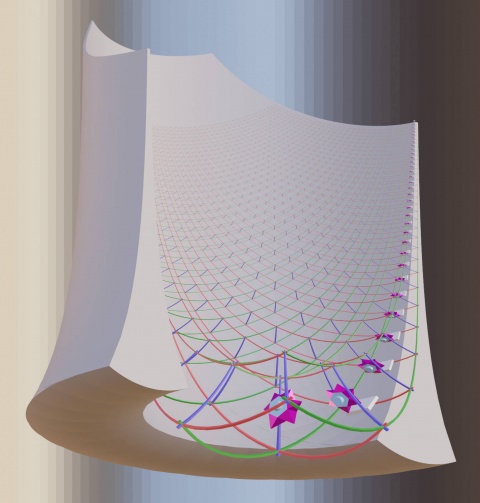
[[File:LogPolarMapping3DwithMolecularMills.jpg|480px|thumb|right|Here mapped is both a c coordinate grid and molecular mill rotors analog to the ones seen in: "Productive Nanosystems from Molecules to Superproducts". Note that in non-transformed coordinates the grey wall sits on xy-plane partly above partly below. Thus it gets curls both ways in the magnifying log polar coordinates. The wide bottom is a small cutout around (0,0,0) that's necessary as nearing zero everything gets exponentially magnified.]] | [[File:LogPolarMapping3DwithMolecularMills.jpg|480px|thumb|right|Here mapped is both a c coordinate grid and molecular mill rotors analog to the ones seen in: "Productive Nanosystems from Molecules to Superproducts". Note that in non-transformed coordinates the grey wall sits on xy-plane partly above partly below. Thus it gets curls both ways in the magnifying log polar coordinates. The wide bottom is a small cutout around (0,0,0) that's necessary as nearing zero everything gets exponentially magnified.]] | ||
| + | |||
| + | [[File:LogPolarMapping3DacrossTwoAssemblyLayers.png|200px|thumb|right|Generalized log polar mapping across two assembly layers. This should be extendable to more. Big caveat here is that assembly layers need to be roughly same sub-layer number which is not at all the case for the lowermost assembly layers. Hard coded assembly lines makes for very many sub-layers.]] | ||
To get a complete picture of the physical layout of all the [[assembly levels]] of the [[convergent assembly]] in a [[nanofactory]] (which might be organized in a stack of coplanar [[nanofactory layers|layers]]) and see all of this in one single image at one glance one needs to project space in a nonlinear way. <br> | To get a complete picture of the physical layout of all the [[assembly levels]] of the [[convergent assembly]] in a [[nanofactory]] (which might be organized in a stack of coplanar [[nanofactory layers|layers]]) and see all of this in one single image at one glance one needs to project space in a nonlinear way. <br> | ||
Revision as of 11:27, 6 February 2024

To get a complete picture of the physical layout of all the assembly levels of the convergent assembly in a nanofactory (which might be organized in a stack of coplanar layers) and see all of this in one single image at one glance one needs to project space in a nonlinear way.
Normal perspective (a linear projection) is unsuitable since it compresses most details towards the horizon.
Instead a nonlinear polar logarithmic mapping is the best fit.
An additional difficulty is that a nanofactory as opposed to a map is inherently three dimensional so some cross cut has to be chosen. Whether that cross cut can be simply planar or not depends on the exact design choices taken in a concrete nanofactories design.
(wiki-TODO: add image [1] -- license?)
Contents
Displaying many scales and their relation simultaneously
This can be done by generalizing log polar mapping to 3D like so:
- x'(x,y,z) = pi/2 - atan2( z, sqrt(pow(x,2) + pow(y,2)) ) * cos(atan2(y,x)))
- y'(x,y,z) = pi/2 - atan2( z, sqrt(pow(x,2) + pow(y,2)) ) * sin(atan2(y,x)))
- z'(x,y,z) = log( sqrt(pow(x,2) + pow(y,2) + pow(z,2)) ) / log(base)
Related
Distorted visualization methods (like e.g. the 3D log polar mapping visualization method) may also be useful to keep oriented in the visualizations of
abstract spaces other than concrete physical space. E.g. circuitry topology in very large software systems.
- More generally: Visualization methods for gemstone metamaterial factories
- Challenges in the visualization of gem-gum factories
- Visualizing the stratified nanofactory layers or other geometries that implements assembly levels.
- Showing only what is needed at anyone time. Related: The software interface principle of "progressive disclosure".
- Drifting off-topic: General software issues
External Links
- Wikipedia on log polar mapping: Log-polar coordinates
- Wikipedia on the Mercator projection which becomes log polar near both poles: Mercator projection
- An interactive online map spanning a wide range of scales: mercator extreme
The mercator projection cut off much closer to the poles whichs location can be freely chosen.
- python scripts to generate log-polar maps from pixelgraphics [2]
- "Detail-In-Context Visualization for Satellite Imagery" [3]
"Complex Logarithmic Views for Small Details in Large Contexts" [4]
by Joachim Boettinger et. al.
Department of Computer and Information Science, University of Konstanz, Germany - Video showing a manual multi-scale zoom device [5] the "zoom-scope"
- square grid mapped to show details on all scales equally [6]
- More large scale map examples [7]
Keywords
distortion lens view; log-polar map; complex logarithmic map, complex logarithmic view, anamorphic mirror, anamorphosis
